Press kit
Lines, snapshots, marks.
Everything you need to write about Sagewai accurately. Strings on this page are pulled at build from canonical-lines.md — never hand-typed.
Canonical lines
Tagline (5 words)
The factory that runs itself.
One-liner (26 words)
Sagewai is the autonomous agent platform: describe the goal, we design the agents, run them in production, and fine-tune local models so every run gets cheaper.
Architecture pitch (29 words)
Five pillars hold up the platform; one spine runs through all of them — that's what makes the agent platform safe to give a credit card.
These are byte-identical with the locked source. Editing any one is a positioning revision, not an editorial choice.
Brand assets
Wordmark — light bg
sagewai_logo.svg
Wordmark — dark bg
sagewai_logo_dark.svg
Icon — light bg
sagewai_icon.svg
Icon — dark bg
sagewai_icon_dark.svg
Wordmark PNG (WebP) — light
sagewai_logo.webp
Wordmark PNG (WebP) — dark
sagewai_logo_dark.webp
Public-safe variants only. The competitive-analysis files in the brand vault are intentionally not distributed.
Dashboard snapshots
All ten observatory PNGs, downloadable. Filenames preserved for attribution.
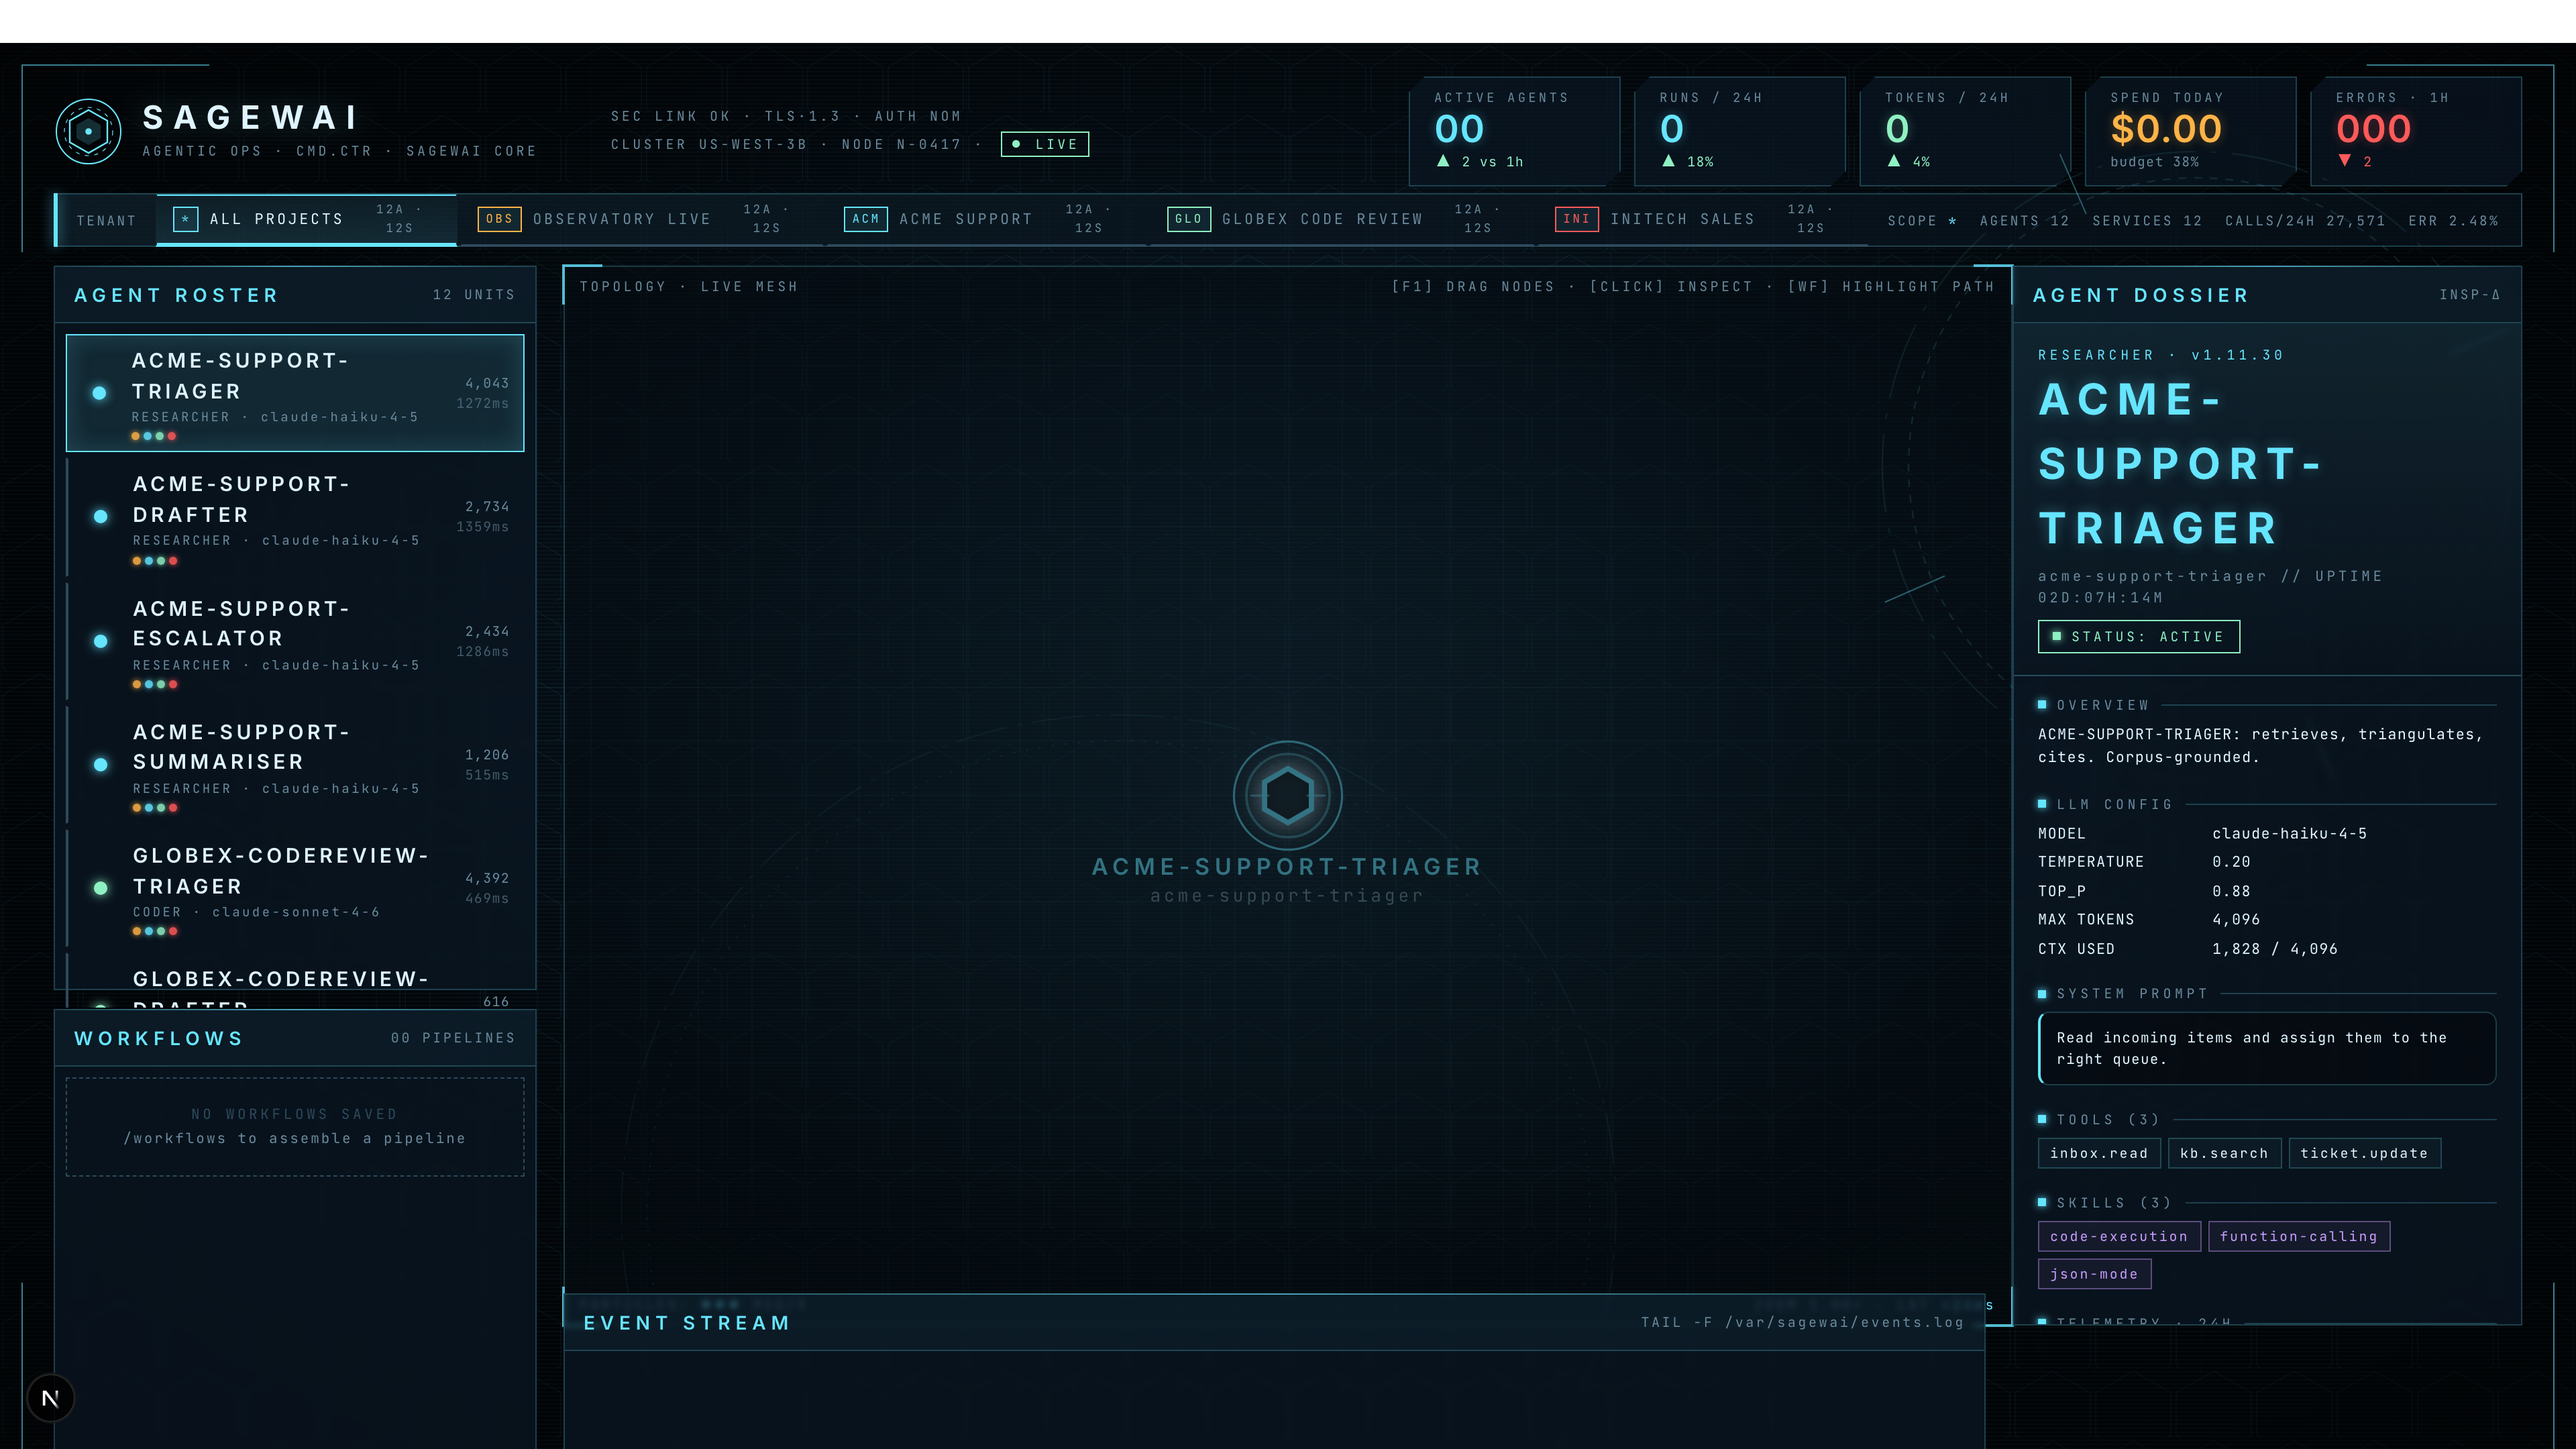
hud-overview.png
Iron Man HUD landing view — live agent graph, 24 workers across acme-prod, globex-prod, initech-prod tenants
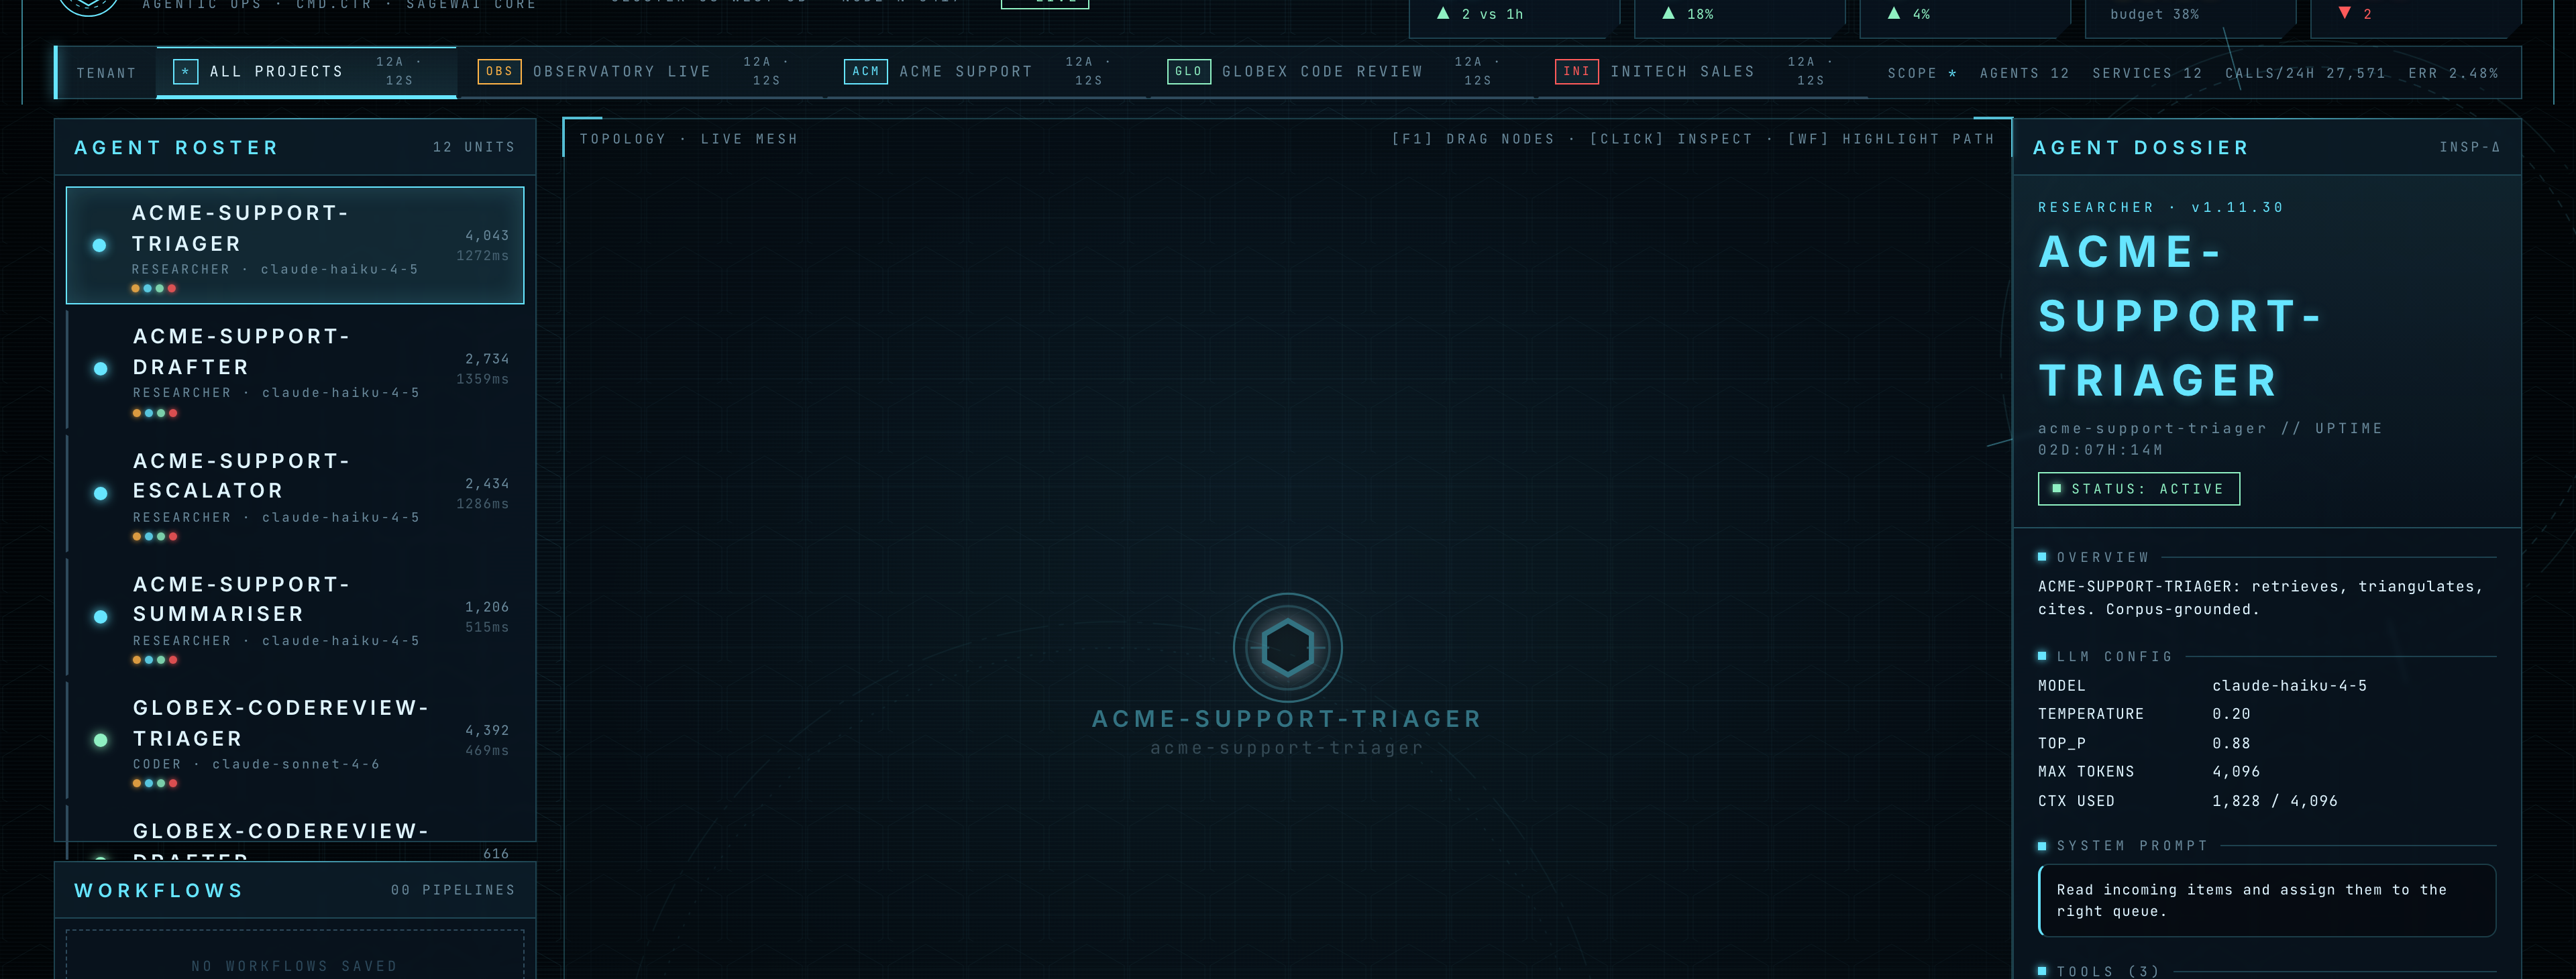
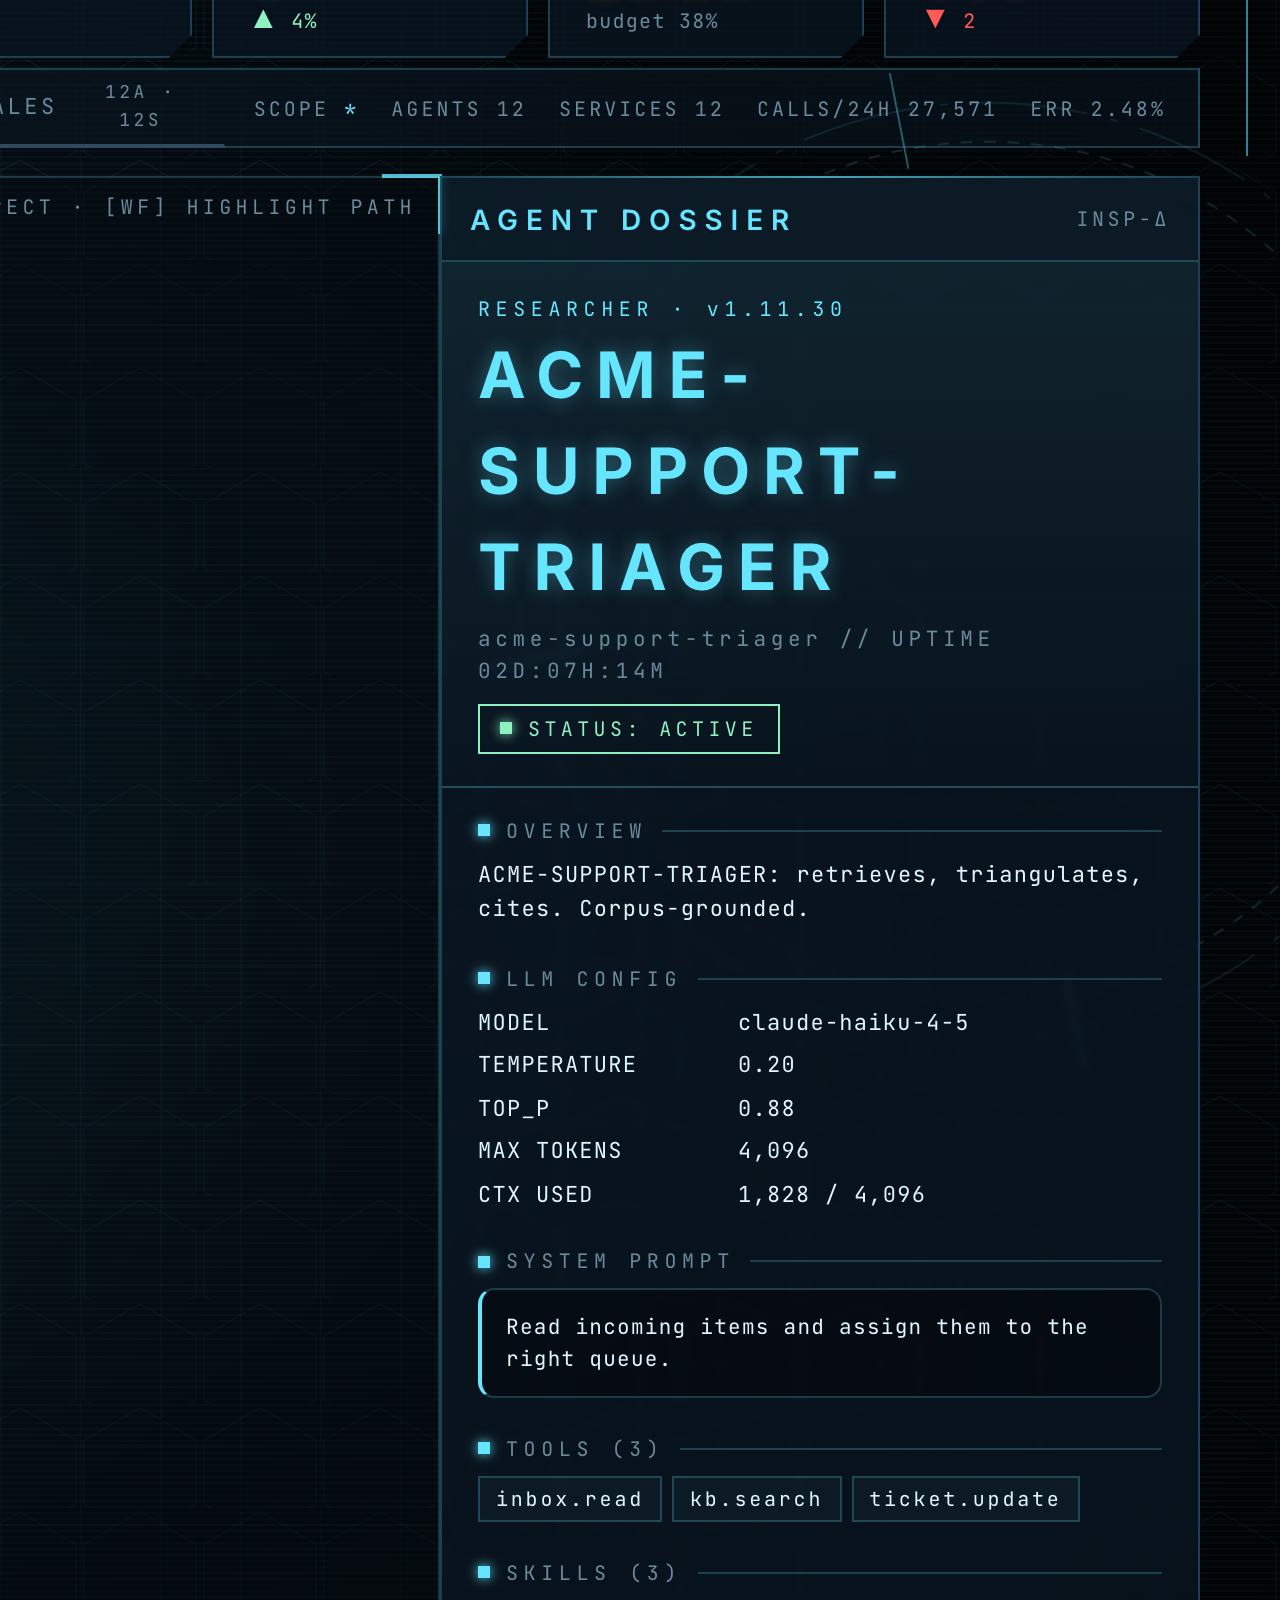
hud-graph-inspector.png
Iron Man HUD agent inspector — single-agent view with mission state, current step, scoped credentials envelope, live cost-per-run
hud-ticker.png
Iron Man HUD live ticker — streaming agent run events, costs, and tenant attributions

hud-topbar-kpis.png
Iron Man HUD top-bar KPIs — workers active, runs in flight, total spend, error rate
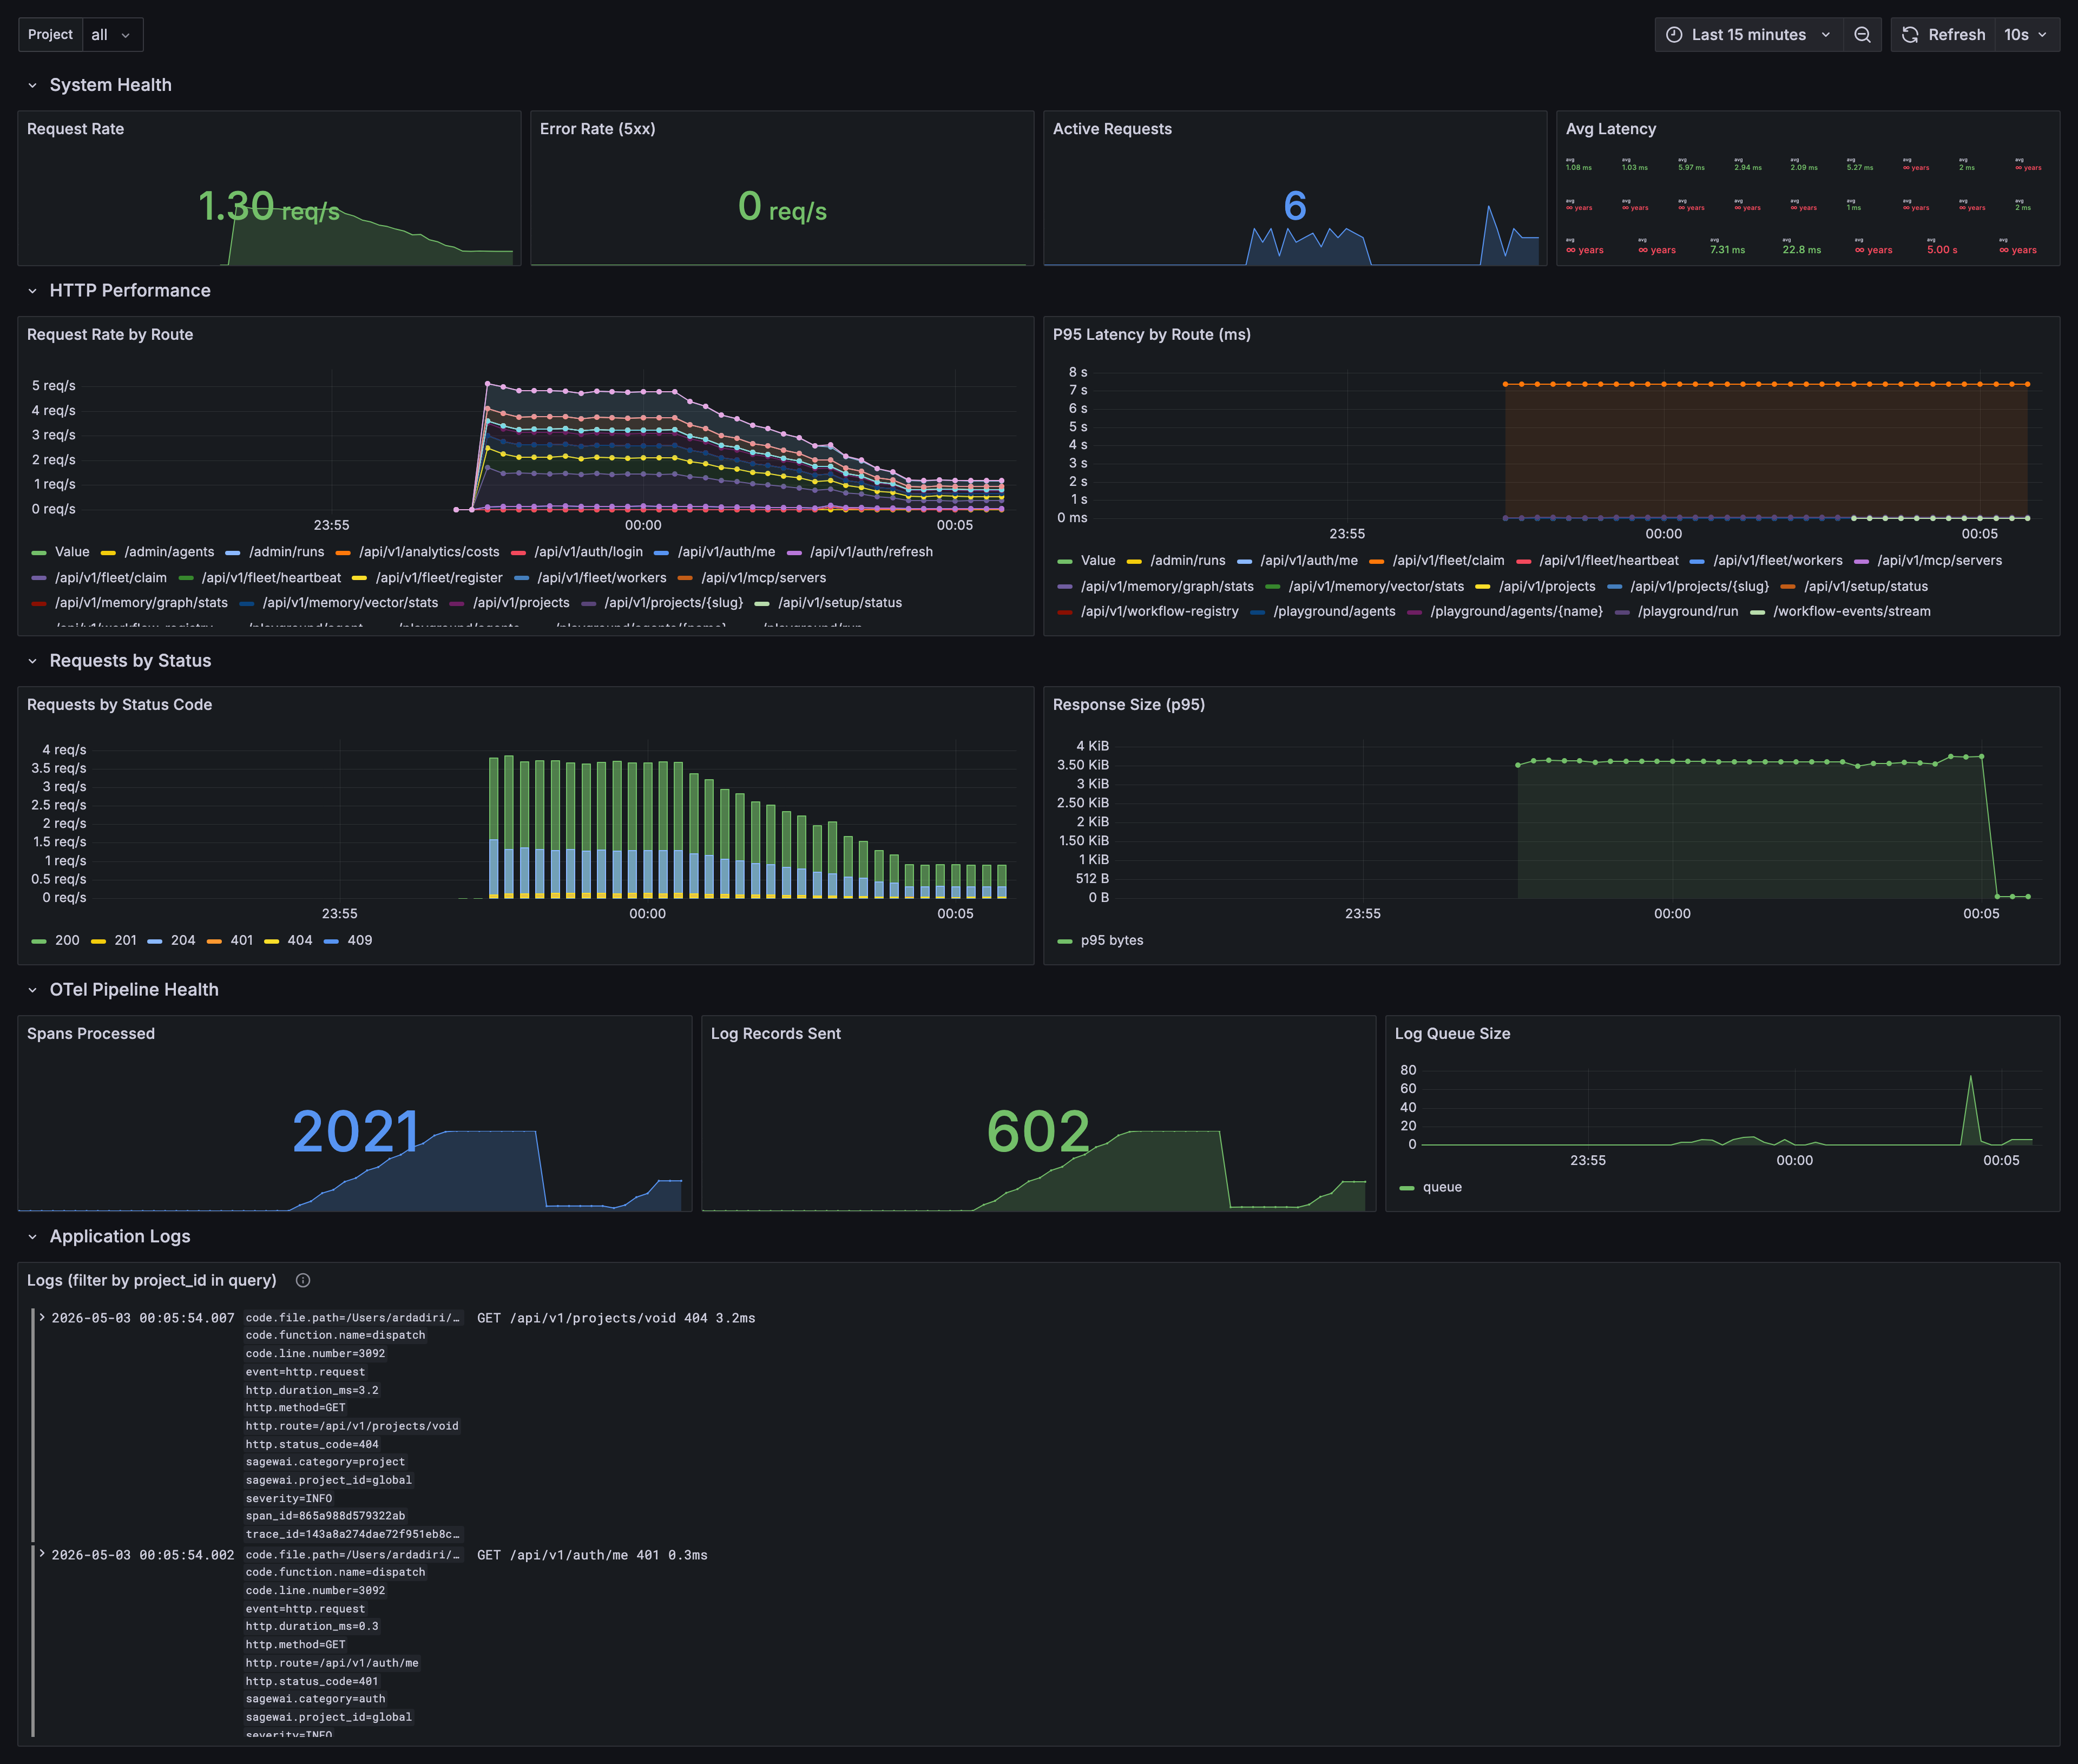
grafana-full-board.png
Grafana full board — every Sagewai panel on one screen, populated by Example 43
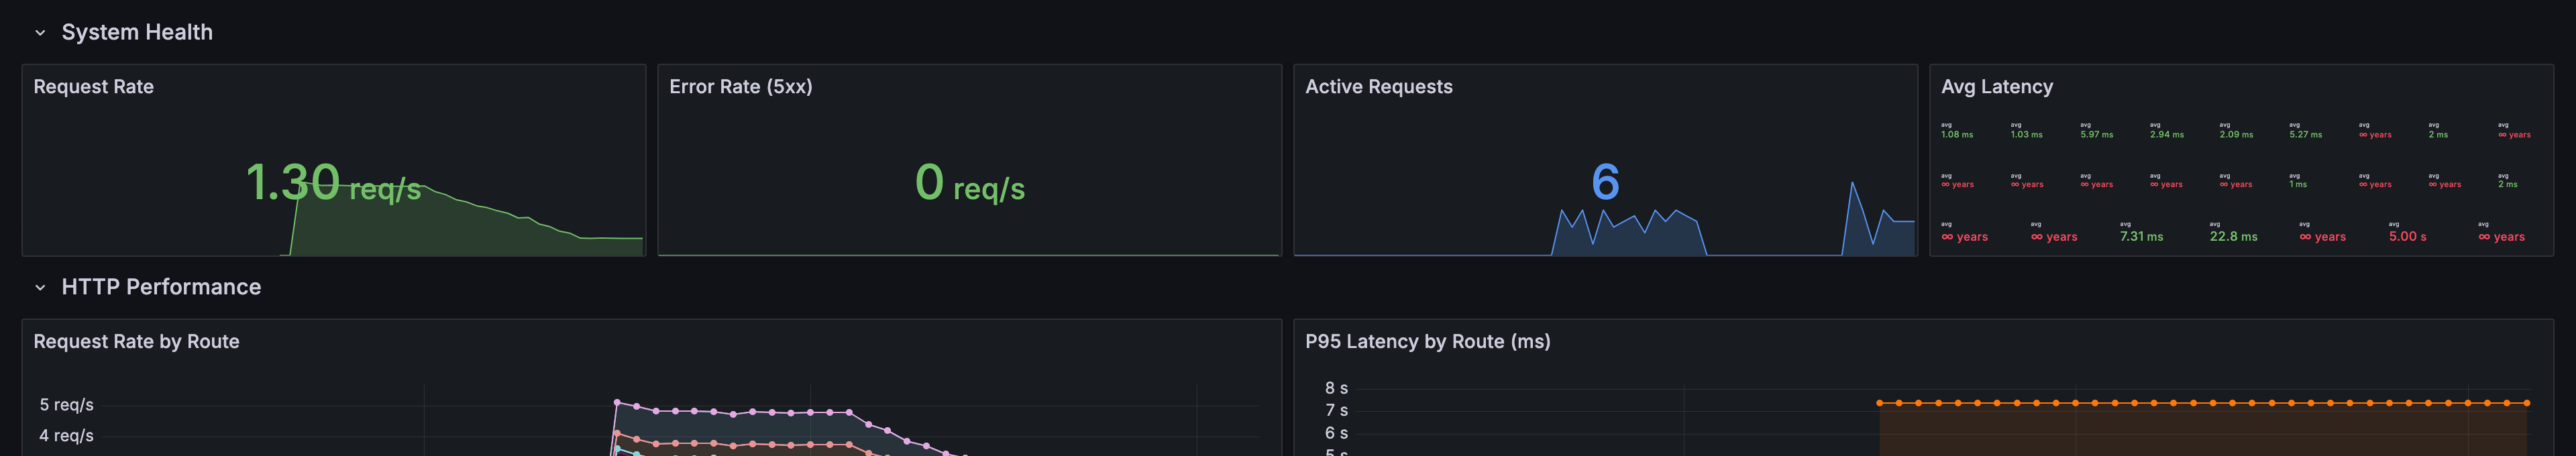
grafana-row1-system-health.png
Grafana row 1 — system health: agent.run.started rate, error rate, p50/p95/p99 latency, OTel pipeline health
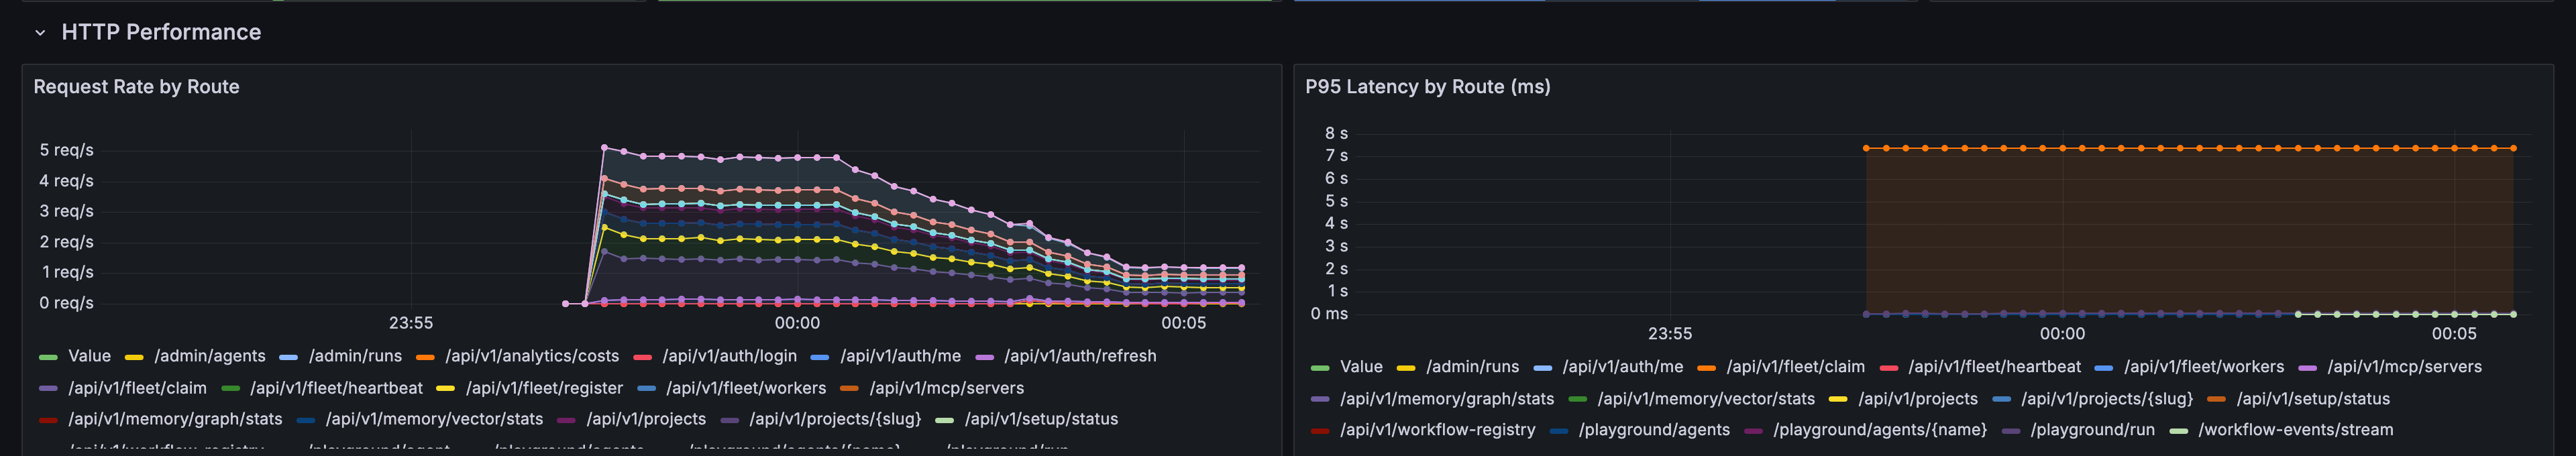
grafana-row2-http-performance.png
Grafana row 2 — HTTP performance per route, status code distribution, request rate
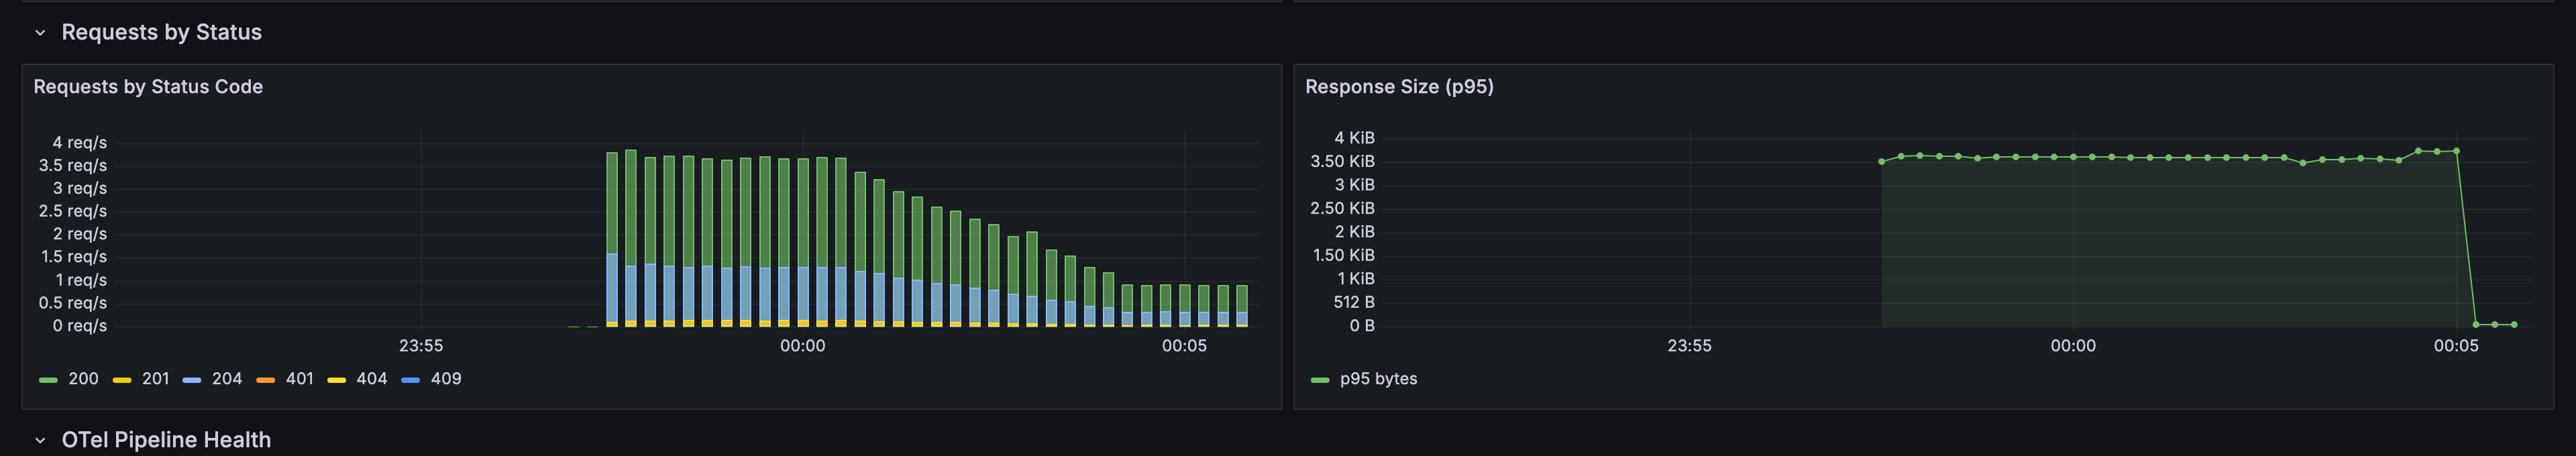
grafana-row3-status.png
Grafana row 3 — fleet status by tenant, queue depth, worker utilisation

grafana-row4-otel-pipeline.png
Grafana row 4 — OTel pipeline health, span-export latency, dropped-span rate
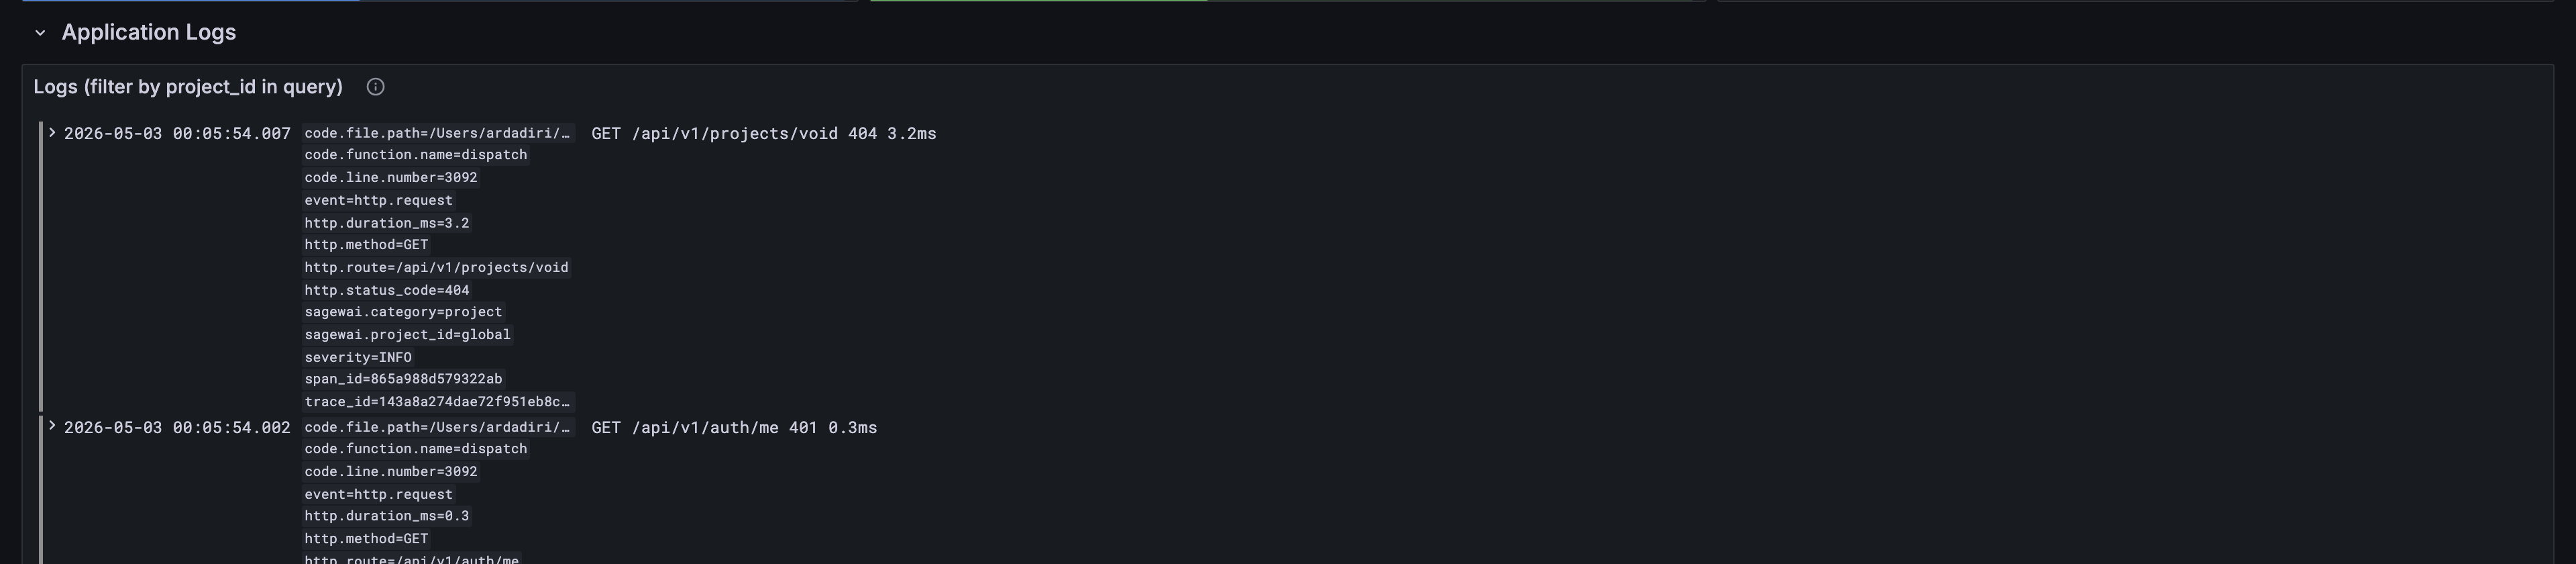
grafana-row5-logs.png
Grafana row 5 — VictoriaLogs structured-log panel, filtered by tenant + level
License
Press may reproduce with credit. Wordmark, icon, and the "Sage" prefix are protected trademarks (see TRADEMARK.md). Screenshots: CC BY 4.0, attribute Sagewai (sagewai.ai).